통계 이야기
빅데이터 분석 ; 연관성 분석(1) ; kaggle 데이터에 적용
728x90
반응형
library(arules)
library(arulesViz)
apriori 알고리즘 패키지
grocery data 패키지

support : 최소 지지도
confidence : 최소신뢰도
minlen : 최소물품수
maxlen : 최대물품수
smax : 최대지지도

ecl <- eclat(Groceries, parameter=list(support=2/9835,minlen=2 ,maxlen=10))
inspect(sort(ecl)[1:50])
summary(ecl)
즉, 2회이상 거래가 이루어진 2품목이상 10품목이하의 itemset의 support를 구하는 함수 입니다.
inspect를 통해 지지도가 가장 큰 것부터 50개를 알아본다.

other vegegables와 whole milk의 지지도가 0.07로 가장 크다.
즉, 전체 품목 중 other vegegables와 whole milk가 함께 선택될 확률은 0.07
rule <- apriori(Groceries, parameter=list(minlen=2))
rule <- apriori(Groceries, control=list(verbos=F), parameter=list(support=50/9835, confidence=0.6 ,minlen=2))
control=list(verbos = F) 함수는 apriori는 복잡한 계산과정을return 하는데 계산과정을 없애준다.
inspect(rule)
즉, 'root vegetables와 onions를 사는 사람은 other vegetables를 산다.' 라고 해석 할 수 있다.
rule_s <- apriori(Groceries, parameter=list(support=50/9835,confidence=0.3, minlen=2, maxlen=6),
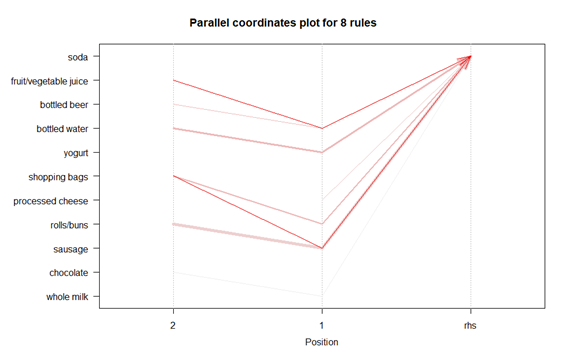
appearance=list(rhs="soda",default='lhs'))
rule_s <- sort(rule_s, by='lift')
inspect(rule_s)
hs가 궁금한 것이고 rhs가 soda가 되는 것입니다. 이것을 lift가 큰 순서대로 sorting.
시각화 부분
plot(rule_s)
plot(rule_s,method="paracoord")
plot(rule_s,method="grouped")
plot(rule_s,method="graph")


728x90
반응형
'통계 이야기' 카테고리의 다른 글
| 빅데이터 분석 ; LDA ; logistic regression ; dicision tree ; 동시 비교 (0) | 2021.07.22 |
|---|---|
| 빅데이터 분석 ; logistic regression ; 로짓분석 ; 분류분석 ; classification analysis (0) | 2021.07.21 |
| 빅데이터 분석 ; LDA(선형판별분석) QDA(2차판별분석) (0) | 2021.07.20 |
| 빅데이터 분석 ; 연관성 분석(2) ; kaggle 데이터에 적용 (0) | 2021.07.19 |
| 빅데이터 분석하기 ; 데이터 탐색하기 (0) | 2021.07.16 |
댓글